
There is a fantastic website: http://tipstrategies.com/geography-of-jobs/. Go check it out.
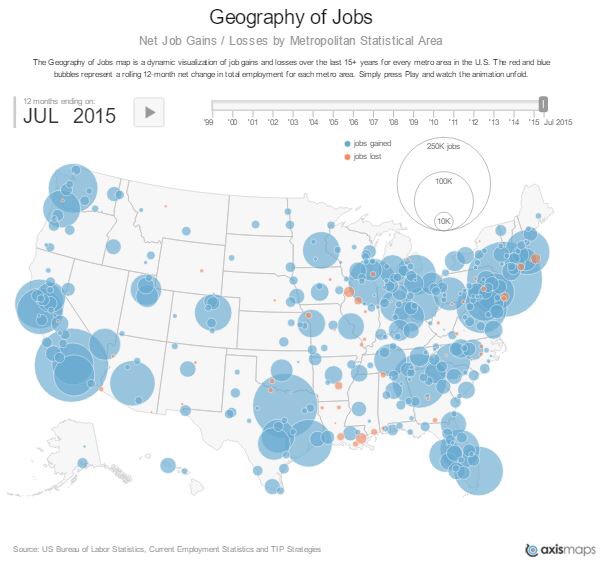
It’s a geography of jobs map put out by TIP Strategies of Austin, TX, which is a privately held economic development consulting firm. Their map shows a running 12 month net job gain/loss representation for every metro area for which the US Bureau of Labor Statistics reports employment data. It’s an animation and covers the period from January 1999 to July 2015.
Hit the play button and watch the dot com bubble form and burst, the loss of manufacturing to China & other low wage countries when the rest of the country was doing well (see Detroit), the large job increases in Washington DC during George W. Bush’s first term, the effect of Hurricane Katrina, the housing bubble, more manufacturing losses (Detroit again), the Great Recession, the slow start to the recovery, and the steady job growth of late.
Now look at that July 2015 map. There are many more areas with job growth than with job loss, and the growth numbers are much larger. So why do we hear people complain so much about the economy and jobs?
Of course, one possible reason is that the jobs available in 2016 are not the same “quality” of jobs available seventeen years earlier. There is some truth to this. A lot of manufacturing has moved to plants overseas, both during good economic times and bad. This was obvious during the animation by the number of times Detroit was losing jobs during periods of job gains for the rest of the country.
Another reason why the media are showing us the bad news is because bad news sells. This isn’t a truism just in our current social networking age. There’s a saying from the days when most people got their news from television: If it bleeds, it leads. In other words, the bad news is what people remember and what they repeat to others.
Side note: I’ve noticed that NBC Nightly News spends a lot of time on weather related stories. I think it may be a version of “If it bleeds, it leads” because even though the weather disaster may be happening to people in a different part of the country or world, we have all experienced scary storms, so we can relate to the troubles others experience. It forms that basic connection that the media want.
So the media want people to have those strong emotional reactions to their reporting. For some, the daily negative messages will make them stop watching the news, but for many more, the bad news draws them in. That is why just about all media outlets interview people who feel desperate after loosing their jobs because of outsourcing (manufacturing, mining, customer support), or to holders of H-1B visas (IT jobs).
It is also why illegal immigration is so often in the news – “They’re taking our jobs!” But are they really? Do we native-born Americans actually want to pick strawberries for 12 hours in the hot sun? I did it in high school; my answer is “No!”
The U.S. economy created 215,000 jobs in July 2015 (net increase), but there we 53 metro areas which experienced job losses. Those 53 metro areas are generally small with an average population of 214,000. The total population of these 53 metro areas accounts for 3.5% of the country’s population.
In some cases, we know about situations which are causing the job losses. Atlantic City, for example, has lost its destination vacation status because of the large number of casinos which have opened closer to New York and Philadelphia. For the six metro areas in Louisiana which have lost jobs, low oil prices are to blame.
I compared the average of these 53 metro area with the top ten most populated metro areas and looked for patterns. About 85,498,000 people call the top ten largest metro areas home (New York, Los Angeles, Chicago, Dallas, Houston, District of Columbia, Philadelphia, Miami, Atlanta, and Boston with surrounding areas). That’s 26.6% of the country’s population. My findings:
From July 2014 – July 2015
53 metro areas: Lost jobs at a rate of 0.38% of total population;
Top 10 largest metro areas: Gained jobs at a rate of 1.06% of total population.
From July 2013 – July 2014
53 metro areas: Gained jobs at a rate of 0.34% of total population;
Top 10 largest metro areas: Gained jobs at a rate of 0.99% of total population.
The large cities with the fastest growth over the two year period are Dallas and Atlanta, the cities with the slowest growth are Chicago and Philadelphia.
During this economic recovery, job growth as a percentage of total population is faster in large cities than in small metro areas.
From March 2008 – March 2009
53 metro areas: Lost jobs at a rate of 1.20% of total population;
Top 10 largest cities: Lost jobs at a rate of 1.73% of total population.
During the Great Recession, job losses as a percentage of total population were worse in large cities than in smaller metro areas. The cities with the fastest rate of loss were Miami, Atlanta and Los Angeles, and the cities with the slowest job loss rates were Houston and Washington, D.C.
Between 2010 and 2015, populations have grown
by 1.7% in the 53 metro areas;
by 5.3% in the top 10 largest metro areas.
Conclusions
1. Because of farming and resource development businesses in rural locations and smaller cities, lower population metro areas may be buffered against the worst effects of a recession;
2. If a large employer shutters operations in a smaller community, the effects can be devastating for that metro area;
3. Larger cities may have a higher percentage loss of jobs during a recession, but they also tend to have stronger social safety net programs and subsidized public transportation to help people back into the workforce;
4. Larger cities seems to have better job gain performance during a recovery;
5. The country is becoming more urban, and finally;
6. The reason we hear so many stories about lost jobs and poor job prospects is because it’s an election year, and the media want people to hear bad news because it generally drives up ratings.
I would like to hear your thoughts on this post. Thanks.
